




Oil-Change Facility: Setting Goals with the 10th Percentile
What This Problem Teaches
- Apply the Central Limit Theorem to transform a skewed population into a normal sampling distribution
- Calculate standard error to understand the variability of sample means
- Use z-scores and percentiles to set performance benchmarks in business contexts
- Distinguish between population parameters and sample statistics in practical applications
- Convert between z-scores and actual values in a normal distribution
Visualizing the Problem
Here's what the sampling distribution looks like, with the 10% left tail highlighted:
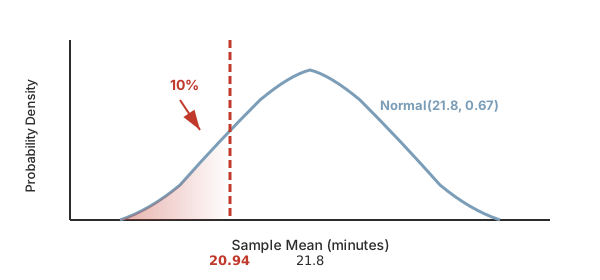
Even though individual oil-change times are skewed right, the Central Limit Theorem tells us that sample means will be normally distributed because our sample size (n = 45) is large enough.
Solution: Method 1 — Z-Score Back-Solving Approach
Step 1 — Apply the Central Limit Theorem
Even though the population of oil-change times is skewed right, the distribution of sample means will be approximately normal because n = 45 ≥ 30. This is the key insight that makes this problem solvable.
The Central Limit Theorem states that regardless of the population's shape, sample means approach a normal distribution as sample size increases. With n = 45, we're well into the range where this approximation is excellent.
Step 2 — Identify the sampling distribution parameters
For the distribution of sample means:
- Mean of sample means:
μ_x̄ = μ = 21.8 minutes - Standard error:
σ_x̄ = σ/√n = 4.5/√45 = 4.5/6.708 = 0.671 minutes
Step 3 — Find the z-score for the 10th percentile
We need the z-score where 10% of the standard normal distribution lies to the left. From standard normal tables:
Step 4 — Convert the z-score to the actual goal time
Using the z-score formula: x = μ + z·σ
Solution: Method 2 — Direct Inverse Normal Calculation
Step 1 — Set up the sampling distribution
As established by the CLT, sample means are normally distributed with μ = 21.8 and σ_x̄ = 0.671.
Step 2 — Use inverse normal function
We want to find the value x such that P(X̄ ≤ x) = 0.10, where X̄ represents the sample mean.
This gives us the same result as Method 1, but in one step using technology or statistical software.
Step 3 — Interpret the result
The manager should set the goal at approximately 20.94 minutes. This means that on any given Saturday, there's only a 10% chance that the average time for 45 oil changes will be 20.94 minutes or less.
There will be a 10% chance of the sample mean being at or below this value.
Verification
Let's verify our answer by checking that 20.94 minutes corresponds to the 10th percentile:
Looking up z = -1.28 in the standard normal table gives us 0.1003 ≈ 0.10 or 10%. ✓
Practical check: The goal (20.94 minutes) is less than the population mean (21.8 minutes), which makes sense for a 10th percentile target. The difference of 0.86 minutes represents about 1.28 standard errors, which aligns with our z-score.
Watch Out For These
✗ Using the population standard deviation instead of standard error
Incorrect calculation: z = (x - 21.8)/4.5 gives x = 21.8 + (-1.28)(4.5) = 16.04 minutes
Why it's wrong: We're finding the percentile for sample means, not individual oil changes. Sample means have less variability than individual values, so we must use σ/√n = 0.671, not σ = 4.5.
✗ Assuming the sampling distribution is skewed like the population
Some students think: "The population is skewed right, so I can't use normal distribution methods."
Why it's wrong: The Central Limit Theorem transforms the sampling distribution into approximately normal, regardless of population shape, when n ≥ 30. With n = 45, the normal approximation is excellent.
✗ Using z = +1.28 instead of z = -1.28
This gives: x = 21.8 + (1.28)(0.671) = 22.66 minutes
Why it's wrong: The 10th percentile is below the mean, so we need a negative z-score. Positive 1.28 corresponds to the 90th percentile, not the 10th.
The Underlying Pattern
This problem illustrates the general process for finding percentiles in sampling distributions:
The key insight is that the Central Limit Theorem allows us to use normal distribution methods even when the underlying population isn't normal. This makes percentile calculations possible for sample means in virtually any real-world scenario with adequate sample size.
Important limitation: This approach requires n ≥ 30 for the CLT to provide a good normal approximation. For smaller samples from skewed populations, the sampling distribution may still retain some skewness.
Why This Matters
This type of analysis appears frequently in business and quality control:
- Manufacturing: Setting quality benchmarks where only 5% or 10% of production batches fall below a performance threshold
- Service industries: Establishing response time goals that balance achievability with customer expectations
- Healthcare: Setting treatment duration targets where most patients (90%) exceed the goal, ensuring realistic expectations
The power of this approach is that it accounts for natural sampling variation—the manager isn't setting an impossible standard, but rather one that reflects the inherent randomness in operational data.
Four "What-If?" Problems
For the 90th percentile: z₀.₉₀ = +1.28
Standard error: σ_x̄ = 4.5/√45 = 0.671 minutes
Goal = 21.8 + (1.28)(0.671) = 21.8 + 0.859 = 22.66 minutes
Check: z = (22.66 - 21.8)/0.671 = +1.28 ✓
Answer: 22.66 minutes
With n = 16: σ_x̄ = 4.5/√16 = 4.5/4 = 1.125 minutes
Since n = 16 < 30 and the population is skewed right, the normal approximation is questionable but we'll proceed: z₀.₁₀ = -1.28
Goal = 21.8 + (-1.28)(1.125) = 21.8 - 1.44 = 20.36 minutes
Warning: With n = 16 and a skewed population, the sampling distribution may still be somewhat skewed. The normal approximation is less reliable, and the actual probability might not be exactly 10%.
Answer: ~20.36 minutes (with reduced confidence)
For the 5th percentile: z₀.₀₅ = -1.645
Standard error: σ_x̄ = 4.5/√45 = 0.671 minutes
Goal = 21.8 + (-1.645)(0.671) = 21.8 - 1.104 = 20.70 minutes
Check: z = (20.70 - 21.8)/0.671 = -1.64 ✓
This goal is more challenging than the 10% goal (20.70 vs 20.94), as expected.
Answer: 20.70 minutes
Standard error: σ_x̄ = 4.5/√45 = 0.671 minutes
z = (21.0 - 21.8)/0.671 = -0.8/0.671 = -1.192
Look up z = -1.19 in the standard normal table:
P(Z ≤ -1.19) = 0.117
There is approximately an 11.7% chance that the sample mean will be 21.0 minutes or less.
This goal (21.0 minutes) is slightly easier to achieve than the original 10% goal, since 11.7% > 10%. The manager might consider this acceptable or might want to lower the goal further.
Answer: 11.7% chance
Frequently Asked Questions
2026-11-21